Patio weather is officially here, but Arizona will not soon forget the scorching summer months. This year, Arizona broke several temperature records, and Phoenix saw its hottest summer since 1895.
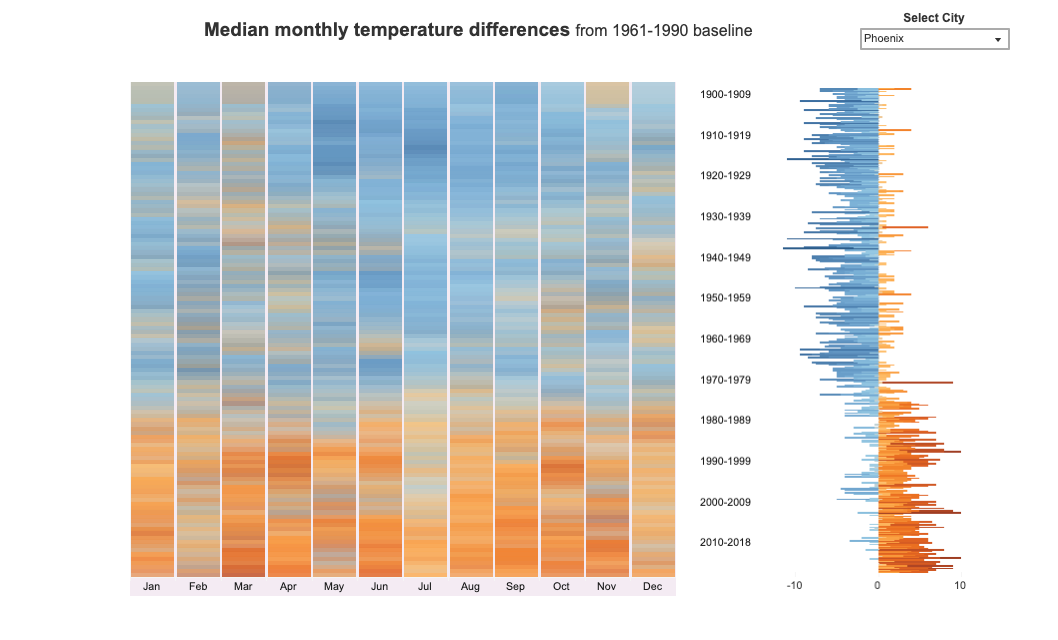
The historic temperature visualization developed by Arizona State University's Knowledge Exchange for Resilience is a tool that shows shifts in temperatures using an interactive heat map and bar graph. It includes historical Arizona temperatures from the 1890s to the present.
Some of the most significant data points and trends:
Phoenix experienced 128 days with temperatures over 100°F in 2018. Tempe had 83.
Its analysis highlights that since 2010 the median monthly temperature for the month of June deviated 4.1°F above the baseline observed between 1961–1990 in Phoenix. This marks a break-even point in the temperature rise phenomenon and highlights how the temperature deviation from baseline accelerated since the last decade.
Since 2010 the median monthly temperature for the month of June deviated 2.3°F above the baseline observed between 1961–1990 in Tempe.
"The raw data from the Arizona State Climate Office features 130,000 traces of daily temperature data spanning across three cities over 130 years. It was challenging to transform such an extensive data set into a useful visualization,” said the lead scientist for the tool, Assistant Research Professor Sarbeswar Praharaj, PhD with the Knowledge Exchange for Resilience.
“It was essential to stay grounded in science, make it visually appealing and easy to use for our stakeholders and community,” he added.
The warm and cool color palette highlights the degree of temperature changes from the baseline number. The data is organized by month, which shows changes over a calendar year and allows users to travel back several decades or just to last summer.
The rise of Phoenix
“The shift in colors from blue to red shows a significant change in temperatures starting in the 1970s,” said state climatologist Nancy Selover with the Arizona State Climate Office.
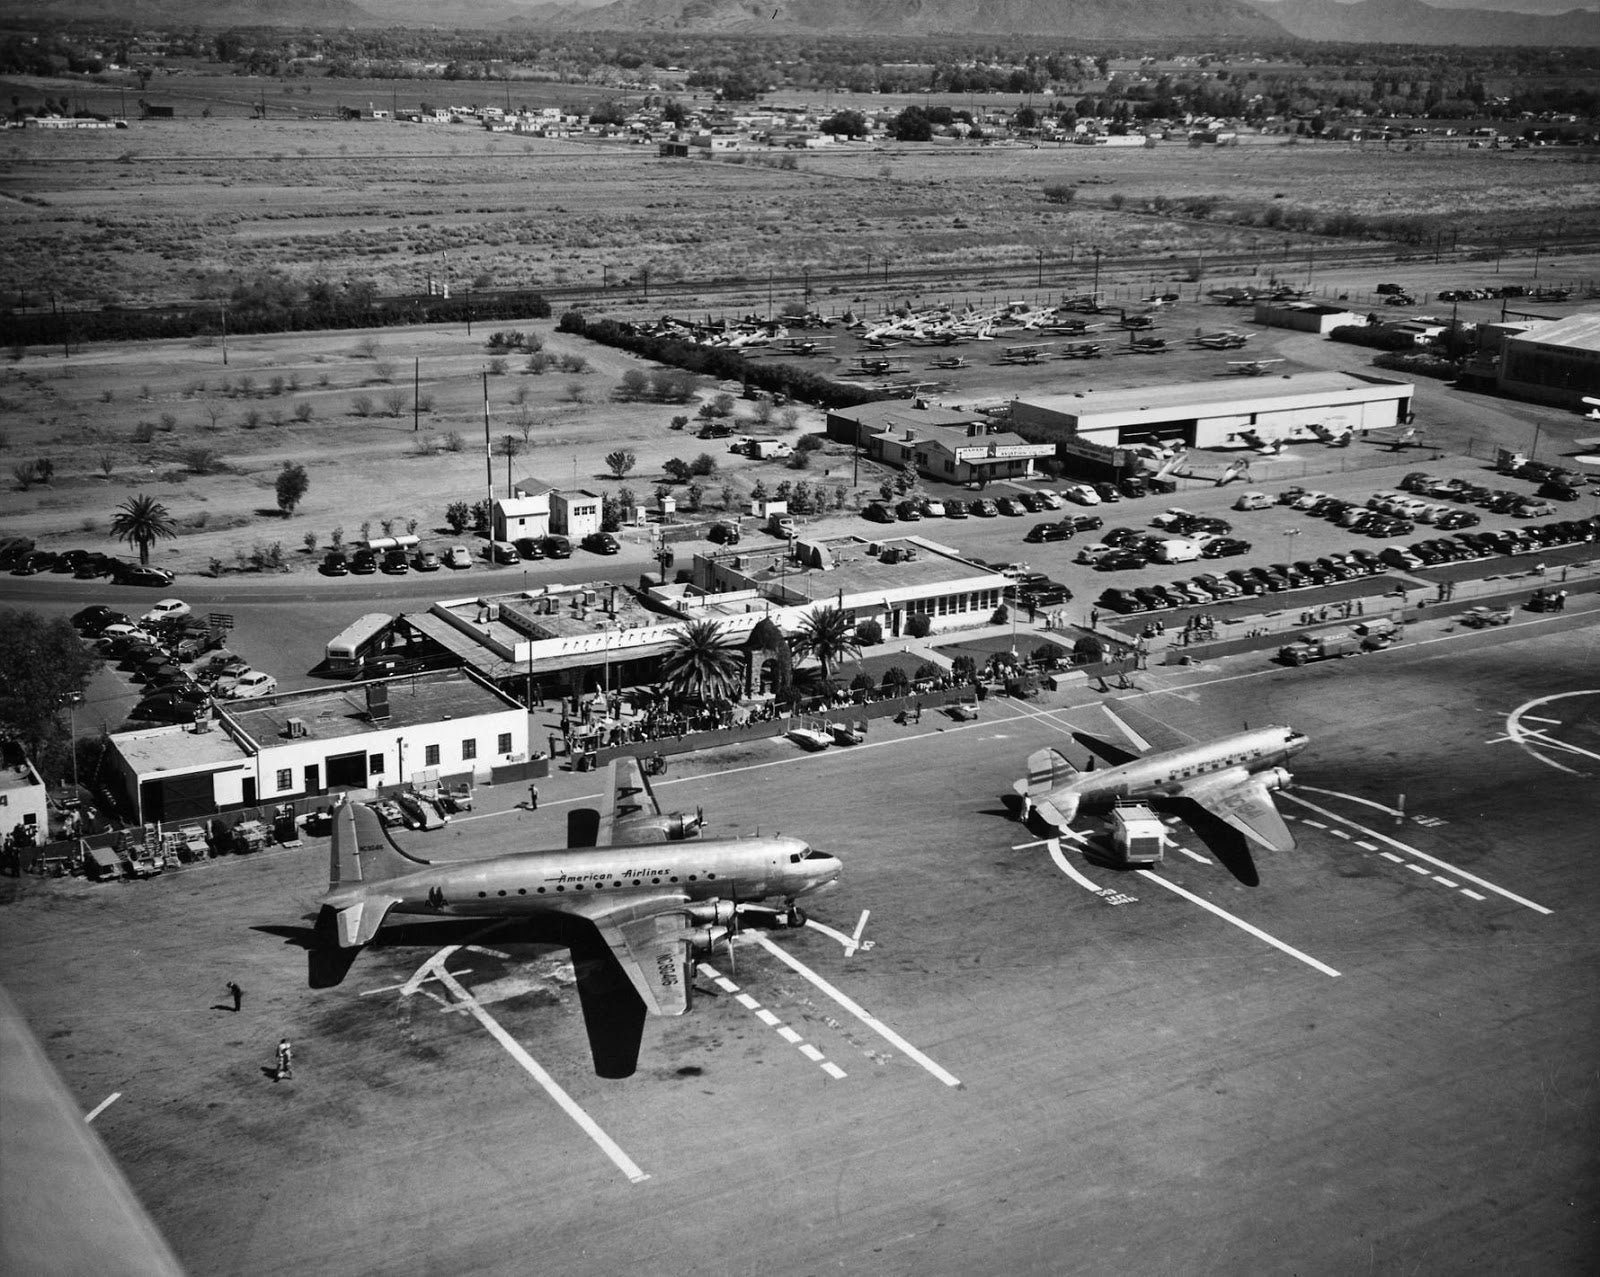
A tower at Sky Harbor airport collects weather data for the city of Phoenix. The transformation of the airport represents the story of a city growing a new identity.
In the 1930s, the rural airport that would become Sky Harbor was nicknamed "The Farm," and surrounded by agriculture. A few decades later, the airport and city would explode with urban development.
Image courtesy Phoenix Sky Harbor.
"The city started to take off in the early '70s, and then the building of I-10 during the '80s allowed people to start moving farther away from their jobs and pushed even more development," Selover said.
New houses, tall buildings and dark pavement would become the new normal. Rapid urban growth would create impacts on heat and temperature for decades to come.
Changes in the landscape and use of materials
The heat-island effect is one critical contributor to the heat.
"In the natural desert, you will see desert sand turf surfaces at 150 to 180 degrees Fahrenheit. When you go down 4 or 5 inches, it's back to the 80s and much cooler," Selover said.
Natural surfaces like vegetation, sand and desert turf have more airspace between them. The heat stays in the top few inches of the soil or surface.
"As the sun goes down, the soil starts to cool immediately. All the heat starts to come back up and dissipate. And within 15 minutes, you walk barefoot on the sand — no big deal," Selover said.
On the other hand, dense material like asphalt or concrete holds molecules tightly in place. When the top surface gets hot, the vibrating molecules will travel far and fast.
"With concrete or asphalt, it takes all night long for the heat to come back out. As the heat continues to go back out, it's heating the air above it too, so it doesn't ever get cool overnight," she added.
Arizona had 29 record-breaking morning temperatures of 90 degrees or warmer this year.
Weather experts anticipate Arizona could break even more records this year with lingering heat and lack of rain. Typically, high-pressure movement from Mexico brings moisture and monsoon rain. In 2020, Arizona saw a dry summer and current forecasts show a dry winter nearing too.
“The mild winters and ample sunshine in the Phoenix area continues to be an asset that continues to attract and retain residents. As temperatures continue to rise and rainfall decreases, these climate assets could become a hazard to human health, economic security, plant life, and the overall health of the community," said Elizabeth Wentz, vice provost and dean with the ASU’s Graduate College and director of the Knowledge Exchange for Resilience.
Rising temperatures and lingering heat mean reliable data and heat planning will be critical for a resilient future.
"The visualization data clearly demonstrates the urgent need to address the problem of increasing urban heat due to climate change. KER is designed to lead efforts that provide solutions to the impact of such pressing problems. KER's efforts in the Phoenix metro area will also benefit communities across the United States and around the world,” said Peter Schlosser, vice president and vice provost with ASU’s Julie Ann Wrigley Global Futures Laboratory.
To explore the KER Temperature visualization, visit resilience.asu.edu/temperature. All of the maps and graphs are free to download and use for educational purposes with proper citation.
More Environment and sustainability

Rethinking Water West conference explores sustainable solutions
How do you secure a future with clean, affordable water for fast-growing populations in places that are contending with unending…
Meet the young students who designed an ocean-cleaning robot
A classroom in the middle of the Sonoran Desert might be the last place you’d expect to find ocean research — but that’s…

From ASU to the Amazon: Student bridges communities with solar canoe project
While Elizabeth Swanson Andi’s peers were lining up to collect their diplomas at the fall 2018 graduation ceremony at Arizona…


